
Kimi Sheets is the spreadsheet workflow inside Kimi. Moonshot’s current documentation says it can accept an existing Excel or CSV file, work with cell relationships and cross-sheet links, preview the result online and produce an .xlsx file in the browser. The useful question is not whether Kimi can draw a polished table. It is whether the downloaded workbook preserves the source, uses auditable formulas, handles missing values correctly and keeps its chart editable.
We built a reproducible CSV benchmark to answer that question. The file uploaded successfully to the signed-in Sheets page on August 4, 2026. When we sent the task, Kimi displayed its high-demand alert before generation began. No workbook or chart was produced, so the accuracy test is not run. We publish the data, expected answers, scoring rules and blocker record so the test can be repeated without inventing a result.
Independent guide: Kimi AI Guide is not affiliated with Moonshot AI. Official product details were checked on August 4, 2026. The access result below applies only to one Free account, one small synthetic CSV and one attempt. A capacity blocker is not a score of zero and is not evidence that the spreadsheet engine is inaccurate.
Kimi Sheets at a glance
| Question | Current answer |
|---|---|
| Where do you start? | Open kimi.com/sheets, use the Sheets shortcut or invoke document work in Agent mode |
| What can you provide? | A natural-language task or an existing Excel/CSV file |
| What does Kimi document? | Cell relationships, cross-sheet logic, data analysis, spreadsheet generation and direct .xlsx output |
| Can you inspect before download? | Kimi documents an online preview followed by XLSX download |
| Does a preview prove spreadsheet quality? | No. Formula cells, blank handling, chart objects and the OOXML package must be inspected after download |
| Was our controlled workbook completed? | No. The uploaded CSV reached the entry UI, but generation was blocked by high demand |
Moonshot describes these capabilities in its current Kimi Docs and Kimi Sheets overview. Its Sheets use-case library includes financial models, multi-sheet merges and chart dashboards. Those are product examples, not independent accuracy results.
How to use Kimi Sheets
- Open Kimi Sheets and sign in.
- Upload the CSV or workbook you want to analyze, or describe a new spreadsheet.
- State preservation rules before calculation rules. For example, require an unchanged Raw Data sheet.
- Define how duplicates and blank cells should be treated. Different columns often need different rules.
- Ask for formula-driven fields and summaries rather than pasted answers.
- Specify a native chart when editability matters.
- Preview the result, then download the XLSX.
- Open the workbook locally and inspect formulas, totals, ranges, blanks, chart objects and file integrity.
A safer prompt pattern
Keep the uploaded data unchanged in a sheet named Raw Data.
Create a separate Clean Data sheet.
List every data-quality rule before applying it.
Use formulas for derived values and summaries; do not paste calculated constants.
Preserve source blanks unless I define a calculation-only replacement.
Create an editable native chart, not a screenshot.
Export an editable XLSX and list every assumption.
The phrase “use formulas” is important, but it is not enough by itself. A formula can still reference the wrong rows, count a duplicate or convert a blank rating to zero. Verification must compare the workbook with known expected values.
Our controlled CSV benchmark
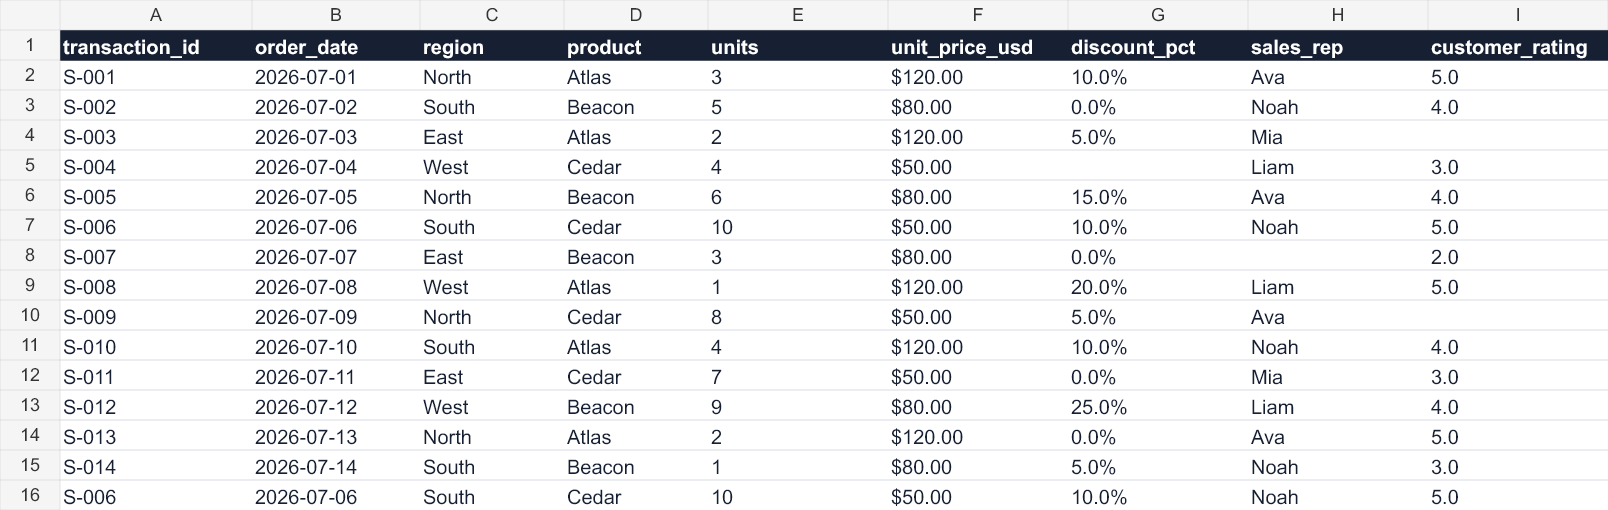
The fixture contains no customer, employee or payment data. It is a small synthetic sales table designed to expose common spreadsheet errors while remaining easy to audit manually.
| Fixture property | Ground truth |
|---|---|
| Source rows | 15 |
| Source columns | 9 |
| Exact duplicate excess rows | 1 |
| Rows after deduplication | 14 |
| Blank cells | 4 |
| Raw units | 75 |
| Deduplicated units | 65 |
| Deduplicated gross revenue | USD 4,810 |
| Deduplicated discount | USD 446 |
| Deduplicated net revenue | USD 4,364 |
| Average rating, ignoring blanks | 3.916666… (3.92 at two decimals) |
The duplicate is a second exact copy of transaction S-006. The four blanks are deliberately split across three fields:
- one blank discount, treated as zero only for calculations;
- one blank sales representative, preserved and flagged rather than invented; and
- two blank customer ratings, preserved and excluded from the average rather than converted to zero.
Required formulas
The clean workbook must derive four fields for each retained transaction:
gross revenue = units × unit price
effective discount = 0 only when discount_pct is blank; otherwise source discount_pct
discount amount = gross revenue × effective discount
net revenue = gross revenue − discount amount
It must then reconcile product and region summaries and create a native bar or column chart titled Net Revenue by Product (Deduplicated). Expected product values are Atlas USD 1,320, Beacon USD 1,664 and Cedar USD 1,380.
Exact task submitted to Kimi
Import the attached CSV and keep an unchanged Raw Data sheet. Create a Clean
Data sheet that removes only exact duplicate transactions, preserving the first
copy. Preserve source blanks. For calculations only, treat a blank discount as
zero; do not invent missing sales representatives or ratings. Add formula-driven
gross revenue, effective discount, discount amount, and net revenue columns.
Create summaries by product and region, calculate the average customer rating
while ignoring blanks, flag the source-quality issues, and add a native bar or
column chart of deduplicated net revenue by product. Export the result as an
editable XLSX.
Result: blocked before workbook generation
| Check | Observed result |
|---|---|
| Signed in | Yes |
| CSV uploaded | Yes, 826 bytes |
| Prompt submitted | Yes, at 18:42:24 PDT on August 4, 2026 |
| Task entered workbook generation | No |
| Visible response | High-demand alert before execution |
| Online workbook preview | None |
| XLSX download | None |
| Formula, totals and blank handling | Not testable |
| Native chart and chart ranges | Not testable |
| Final score | Not calculated |
The CSV’s SHA-256 is 8453707C5DF50099B954A7BBE88C3A4C938396C9A9806329604724E230D30B6E. Local fixture validation passed 13 deterministic checks before upload. That means the benchmark file and expected answers reconcile; it does not mean Kimi Sheets passed the benchmark.
Download the Kimi Sheets benchmark pack. It contains the CSV, ground truth, scoring rubric, validation record, original data preview and raw blocked-run record.
How we will score a completed XLSX
| Category | Points | What must be verified |
|---|---|---|
| Import and data quality | 20 | 15 source rows retained, one duplicate excluded only from clean analysis, 14 clean rows and all four blanks handled by field-specific rules |
| Formula-driven calculations | 30 | Four derived fields are formulas, representative rows and totals reconcile, average rating ignores blanks |
| Product and region summaries | 25 | Counts, units, gross, discount and net values match the ground truth |
| Native chart | 15 | Editable chart object with correct Atlas, Beacon and Cedar ranges, title, units and readable labels |
| Preservation and workbook quality | 10 | Raw Data unchanged, appropriate formats, no obvious formula errors and a valid readable workbook |
The workbook passes our fixture only at 90–100. A small test cannot establish universal Excel compatibility, financial reliability, maximum file size or safety for confidential data.
What to inspect after any Kimi Sheets export
1. Formulas, not just displayed numbers
Select representative detail rows and summary cells. Confirm they contain formulas and point to the intended clean range. Recalculate the file in a current spreadsheet editor and scan for #REF!, #VALUE!, #DIV/0! and similar errors.
2. Raw-data preservation
Compare the Raw Data sheet byte-for-byte or cell-for-cell with the uploaded source. Cleaning should happen in a separate area. A visually improved source sheet is still a source mutation.
3. Missing-data semantics
A blank discount can reasonably become zero for one calculation while a blank rating must remain missing. A single global “fill blanks with zero” rule changes meaning.
4. Duplicate scope
Remove only the duplicate that matches the declared rule. Do not delete two different transactions merely because they share a product, date or amount.
5. Chart editability and ranges
Click the chart and inspect its data source. An image of a chart is not a native chart. A native chart can still be wrong if it includes the duplicate, skips a category or points to pasted constants.
Limits and next test
This page records one upload-stage success and one execution-stage capacity blocker. We did not obtain an XLSX and make no performance claim. The next valid run must use the same CSV and prompt, retain the generated file, inspect the OOXML package, reopen it, render every sheet, scan formulas and score the native chart without follow-up repairs.
For file-size and context planning before other Kimi workflows, use our context and file-fit guide. For our test principles and stop rules, see the methodology page and Kimi AI Test Lab.